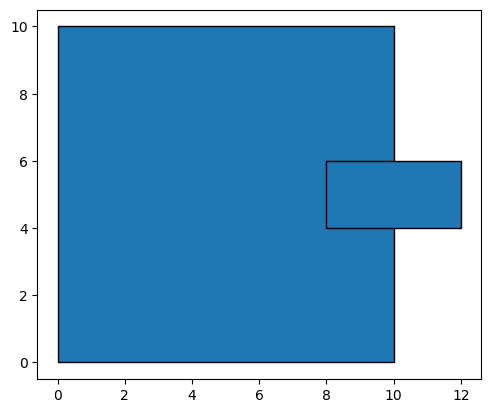
One polygon overlapping another polygon#
import geopandas
import numpy
import matplotlib.pyplot as plt
import geoplanar
from shapely.geometry import box, Polygon
p1 = box(0,0,10,10)
p2 = box(8,4, 12,6)

gdf = geopandas.GeoDataFrame(geometry=[p1,p2])
gdf.plot(edgecolor='k')
<Axes: >
geoplanar.is_overlapping(gdf)
True
gdf.geometry[0]

gdf.geometry[1]

gdf = geoplanar.trim_overlaps(gdf)
geoplanar.is_overlapping(gdf)
largest
largest
False
gdf.geometry[0]
gdf.geometry[1]

gdf.area
0    100.0
1      4.0
dtype: float64
Default trims the largest of the two overlapping polygons#
To have the correction apply the trim to the smaller of the two polygons, set strategy="largest":
p1 = box(0,0,10,10)
p2 = box(8,4, 12,6)

gdf = geopandas.GeoDataFrame(geometry=[p1,p2])
gdf.plot(edgecolor='k')
<Axes: >
gdf_l = geoplanar.trim_overlaps(gdf)
gdf_l.plot(edgecolor='k')
largest
largest
<Axes: >

gdf_s = geoplanar.trim_overlaps(gdf, strategy='smallest')
gdf_s.plot(edgecolor='k')
<Axes: >

gdf_c = geoplanar.trim_overlaps(gdf, strategy='compact')
gdf_c.plot(edgecolor='k')
<Axes: >

geoplanar.trim_overlaps(gdf, strategy=None).plot(edgecolor='k')
<Axes: >
gdf.geometry[0]
gdf.geometry[1]
gdf.area
0    100.0
1      4.0
dtype: float64
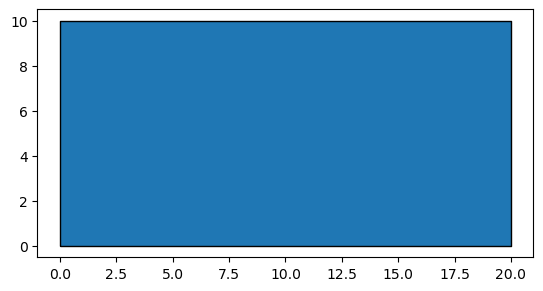
Merge polygons#
p1 = box(0,0,10,10)
p2 = box(8,4, 12,6)

gdf = geopandas.GeoDataFrame(geometry=[p1,p2])
gdf.plot(edgecolor='k')
<Axes: >

# merge features that overlap by at least 10% (and any features with an area less than 1 no matter the overlap %)
gdf = geoplanar.merge_overlaps(gdf, merge_limit = 1, overlap_limit = 0.1)
geoplanar.is_overlapping(gdf)
False
gdf.plot(edgecolor='k')
<Axes: >

gdf.area
0    104.0
dtype: float64
If polygons are larger than the merge limit and the area of overlapping polygons is smaller than the overlap limit, the polygons are not merged.
gdf = geoplanar.merge_overlaps(gdf, merge_limit = 1, overlap_limit = 1)
geoplanar.is_overlapping(gdf)
True
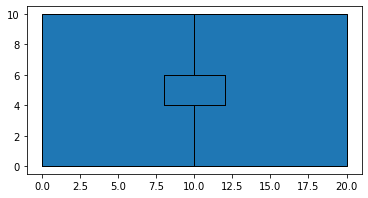
Planar Enforcement Violation: One polygon overlapping two#
As always, care must be taken when carrying out a planar correction, as the result may not be what is desired:
p1 = box(0,0,10,10)
p2 = box(10,0, 20,10)
p3 = box(8,4, 12,6)

gdf = geopandas.GeoDataFrame(geometry=[p1,p2,p3])
gdf.plot(edgecolor='k')
<Axes: >

gdf1 = geoplanar.trim_overlaps(gdf, largest=False) # trim the smallest feature of an intersecting pair
gdf1.area
0    100.0
1    100.0
2      0.0
dtype: float64
gdf1.plot(edgecolor='k')
<AxesSubplot:>

p1 = box(0,0,10,10)
p2 = box(10,0, 20,10)
p3 = box(8,4, 12,6)

gdf = geopandas.GeoDataFrame(geometry=[p1,p2,p3])
gdf2 = geoplanar.trim_overlaps(gdf)
gdf2.geometry
0    POLYGON ((0.00000 0.00000, 0.00000 10.00000, 1...
1    POLYGON ((10.00000 4.00000, 12.00000 4.00000, ...
2    POLYGON ((12.00000 4.00000, 12.00000 6.00000, ...
Name: geometry, dtype: geometry
gdf2.area
0    96.0
1    96.0
2     8.0
dtype: float64
gdf2.plot(edgecolor='k')
<AxesSubplot:>
gdf2 = geoplanar.merge_overlaps(gdf, merge_limit=1, overlap_limit=0.1) # merge features that overlap by at least 10%
gdf2.area
0    200.0
dtype: float64
gdf2.plot(edgecolor='k') #all polygons are merged into a single polygon
<Axes: >