Gaps#
import geopandas
import numpy
import matplotlib.pyplot as plt
import geoplanar
from shapely.geometry import box, Polygon
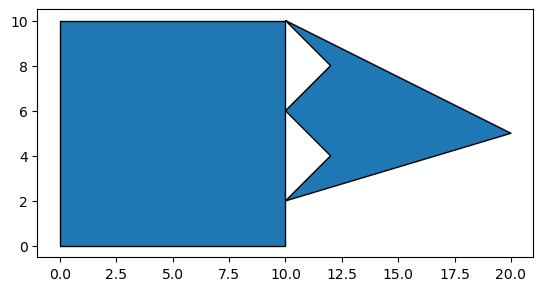
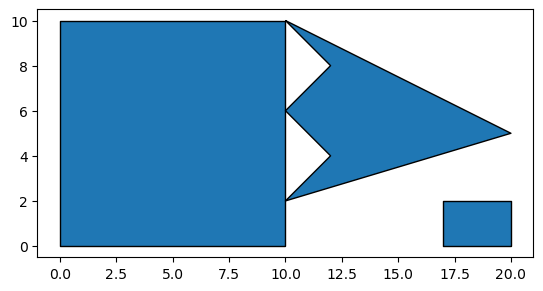
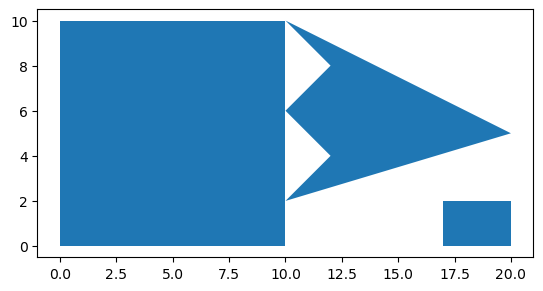
p1 = box(0,0,10,10)
p2 = Polygon([(10,10), (12,8), (10,6), (12,4), (10,2), (20,5)])

gdf = geopandas.GeoDataFrame(geometry=[p1,p2])
gdf.plot(edgecolor='k')
<Axes: >
geoplanar.gaps(gdf)
0     POLYGON ((10 2, 10 6, 12 4, 10 2))
1    POLYGON ((10 6, 10 10, 12 8, 10 6))
dtype: geometry
g = geoplanar.gaps(gdf)
g.area.values
array([4., 4.])
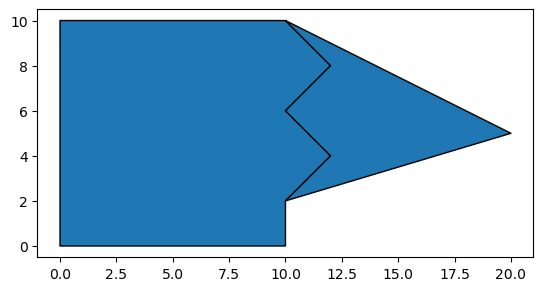
gdf1 = geoplanar.fill_gaps(gdf)
gdf1.plot(edgecolor='k')
<Axes: >
gdf1.area
0    108.0
1     32.0
dtype: float64
gdf.area
0    100.0
1     32.0
dtype: float64
geoplanar.gaps(gdf1)
GeoSeries([], dtype: geometry)
The default is to merge the gap with the largest neighboring feature.
To merge the gap with the smallest neighboring feature strategy=’smallest’:
geoplanar.fill_gaps(gdf, strategy='smallest').plot(edgecolor='k')
<Axes: >

geoplanar.fill_gaps(gdf, strategy='smallest').area
0    100.0
1     40.0
dtype: float64
Maximizing compactness when filling gaps#
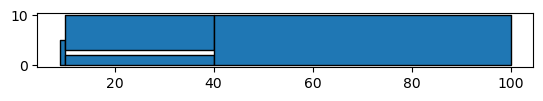
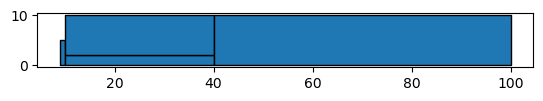
p1 = box(9,0,10,5)
p2 = box(10,0, 40,2)
p3 = box(10,3, 40,10)
p4 = box(40,0, 100, 10)
gdf = geopandas.GeoDataFrame(geometry=[p1,p2, p3, p4])
gdf.plot(edgecolor='k');
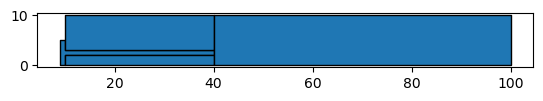
The default will result in attaching the gap to the largest polygon:
geoplanar.fill_gaps(gdf).plot(edgecolor='k').plot
<bound method Axes.plot of <Axes: >>

Attaching to the smallest candidate polygon also results in a non-compact polygon.
geoplanar.fill_gaps(gdf,strategy='smallest').plot(edgecolor='k').plot
<bound method Axes.plot of <Axes: >>
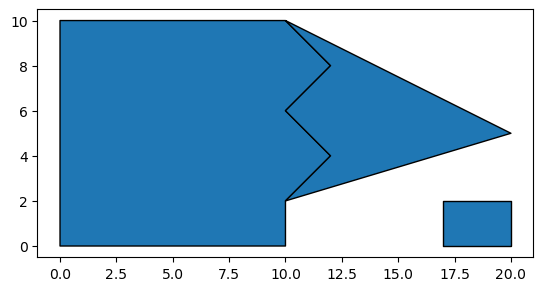
Setting strategy="compact" will instead add the gap to the candidate polygon that results in the new polygon with the highest compactness (measured by the isoperimetric quotient).
geoplanar.fill_gaps(gdf, strategy='compact').plot(edgecolor='k')
<Axes: >
Checking edge case#
p1 = box(0,0,10,10)
p2 = Polygon([(10,10), (12,8), (10,6), (12,4), (10,2), (20,5)])
p3 = box(17,0,20,2)

gdf = geopandas.GeoDataFrame(geometry=[p1,p2,p3])
gdf.plot(edgecolor='k')
<Axes: >
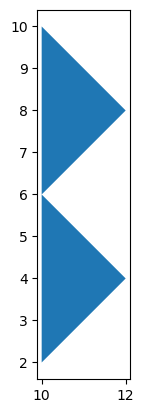
g = geoplanar.gaps(gdf)
g.plot()
<Axes: >
geoplanar.fill_gaps(gdf, strategy='smallest').plot(edgecolor='k')
<Axes: >

geoplanar.fill_gaps(gdf, strategy='largest').plot(edgecolor='k')
<Axes: >
geoplanar.fill_gaps(gdf, strategy=None).plot(edgecolor='k')
<Axes: >
gdf.plot()
<Axes: >
Gap with an inlet (non-gap)#
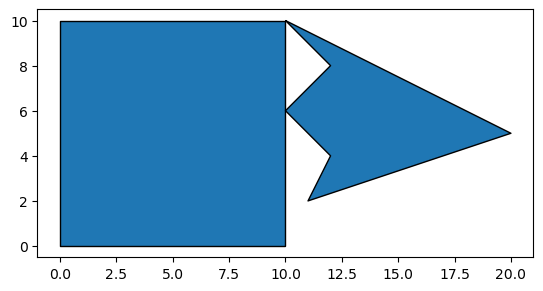
p1 = box(0,0,10,10)
p2 = Polygon([(10,10), (12,8), (10,6), (12,4), (11,2), (20,5)])

# a true gap with an inlet
gdf = geopandas.GeoDataFrame(geometry=[p1,p2])
gdf.plot(edgecolor='k')
<Axes: >
geoplanar.gaps(gdf)
0    POLYGON ((10 6, 10 10, 12 8, 10 6))
dtype: geometry
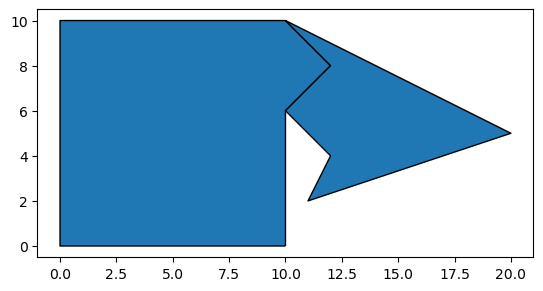
geoplanar.fill_gaps(gdf, strategy='smallest').plot(edgecolor='k')
<Axes: >

geoplanar.fill_gaps(gdf, strategy='largest').plot(edgecolor='k')
<Axes: >
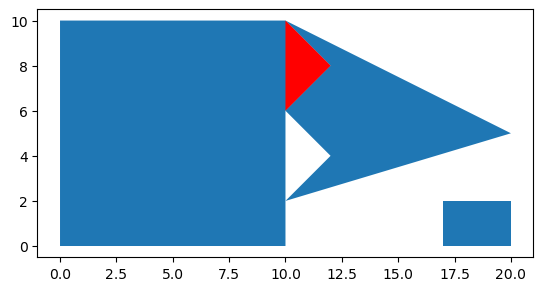
Selective Correction#
p1 = box(0,0,10,10)
p2 = Polygon([(10,10), (12,8), (10,6), (12,4), (10,2), (20,5)])
p3 = box(17,0,20,2)

gdf = geopandas.GeoDataFrame(geometry=[p1,p2,p3])
gdf.plot(edgecolor='k')
<Axes: >
gaps = geoplanar.gaps(gdf)
base = gdf.plot()
gaps.plot(color='red', ax=base)
<Axes: >
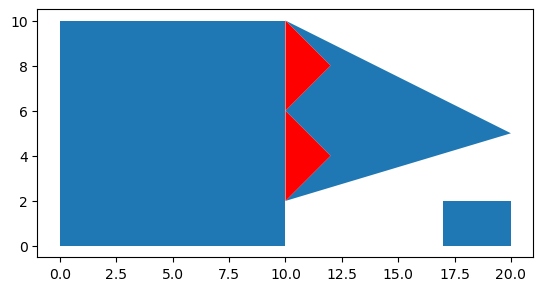
gaps
0     POLYGON ((10 2, 10 6, 12 4, 10 2))
1    POLYGON ((10 6, 10 10, 12 8, 10 6))
dtype: geometry
g2 = gaps.loc[[1]]
g2
1    POLYGON ((10 6, 10 10, 12 8, 10 6))
dtype: geometry
filled = geoplanar.fill_gaps(gdf,g2)
base = filled.plot()
g2.plot(color='red', ax=base)
<Axes: >
filled.area
0    104.0
1     32.0
2      6.0
dtype: float64
filled.shape
(3, 1)
(filled.area==[104, 32,6]).all()
np.True_
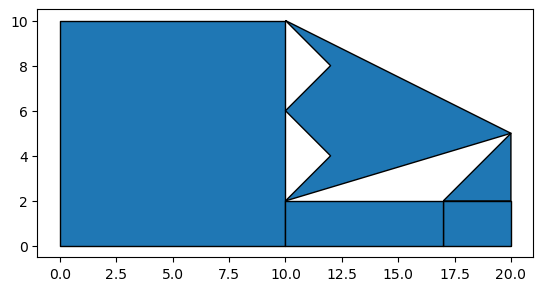
gap coincindent with > 2 polygons#
p1 = box(0,0,10,10)
p2 = Polygon([(10,10), (12,8), (10,6), (12,4), (10,2), (20,5)])
p3 = box(17,0,20,2)
p4 = box(10,0, 17, 2)
p5 = Polygon([(17, 2), (20,5), (20, 2), (17,2)])

gdf = geopandas.GeoDataFrame(geometry=[p1,p2,p3, p4, p5])
gdf.plot(edgecolor='k')
<Axes: >
g = geoplanar.gaps(gdf)
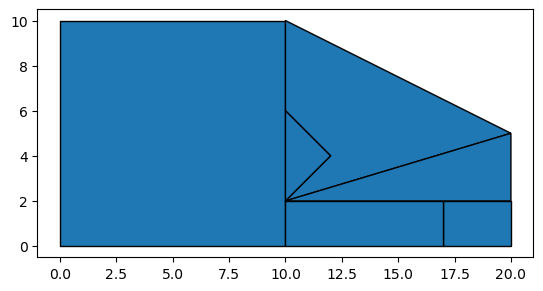
gl = geoplanar.fill_gaps(gdf, strategy='largest')
gl.plot(edgecolor='k')
<Axes: >

gr = geoplanar.fill_gaps(gdf, strategy='smallest')
gr.plot(edgecolor='k')
<Axes: >
gr = geoplanar.fill_gaps(gdf, strategy=None)
gr.plot(edgecolor='k')
<Axes: >
gl.geometry
0    MULTIPOLYGON (((17 2, 10 2, 20 5, 17 2)), ((12...
1    POLYGON ((10 10, 12 8, 10 6, 12 4, 10 2, 20 5,...
2             POLYGON ((20 0, 20 2, 17 2, 17 0, 20 0))
3             POLYGON ((17 0, 17 2, 10 2, 10 0, 17 0))
4                   POLYGON ((17 2, 20 5, 20 2, 17 2))
Name: geometry, dtype: geometry
gr.geometry
0    POLYGON ((10 0, 0 0, 0 10, 10 10, 12 8, 10 6, ...
1    POLYGON ((10 10, 12 8, 10 6, 12 4, 10 2, 20 5,...
2             POLYGON ((20 0, 20 2, 17 2, 17 0, 20 0))
3    MULTIPOLYGON (((17 0, 10 0, 10 2, 20 5, 17 2, ...
4                   POLYGON ((17 2, 20 5, 20 2, 17 2))
Name: geometry, dtype: geometry
gdf.geometry
0             POLYGON ((10 0, 10 10, 0 10, 0 0, 10 0))
1    POLYGON ((10 10, 12 8, 10 6, 12 4, 10 2, 20 5,...
2             POLYGON ((20 0, 20 2, 17 2, 17 0, 20 0))
3             POLYGON ((17 0, 17 2, 10 2, 10 0, 17 0))
4                   POLYGON ((17 2, 20 5, 20 2, 17 2))
Name: geometry, dtype: geometry
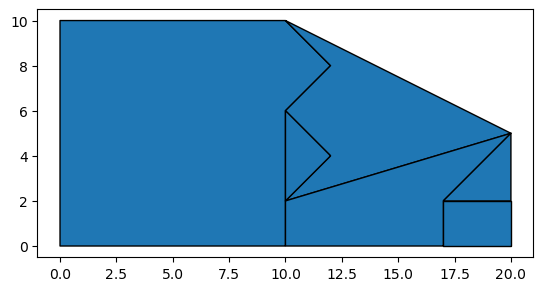
gc = geoplanar.fill_gaps(gdf, strategy='compact')
gc.plot(edgecolor='k')
<Axes: >
